Features
Breadcrumbs
Breadcrumbs display a list of links to the current element and its ancestors in the top part of the page.
Breadcrumbs can be enabled or disabled via:
Settings > Workbench > Breadcrumbs
The settings section contains a number of additional preferences to tweak what to display exactly (e.g. icons, symbols, complete path to the file, etc).
Breadcrumbs are provided by the lsp-mode package. To enable breadcrumbs:
(setq lsp-headerline-breadcrumb-mode t)
You can also customize what to display in the breadcrumbs by
customizing the lsp-headerline-breadcrumb-segments variable. For
more information please refer to the official lsp-mode
documentation.
Code Completion
Get context-aware code completions for function names, macros, records, variable names and more.

Go To Definition
Navigate to the definition of a function, macro, record or type.

Go To Implementation for OTP Behaviours
Hovering a gen_server:start_link call? Jump to the respective init
function with a single keystroke.

Signature Suggestions
Never remember the order of the lists:keytake/3 arguments? You are
not alone. We got you covered.

Compiler Diagnostics
Display warnings and errors from the compiler. Inline.

Dialyzer Diagnostics
It has never been so easy to make Dialyzer happy.

Elvis Diagnostics
Display Elvis style suggestions inline. No more nit-picking comments from colleagues!

Edoc
Hover a local or remote function to see its edoc. You will miss this
feature so much when edocs are not available that you will start
writing them!

Navigation for Included Files
Navigate to included files with a single click.

Find/Peek References
Who is calling this function? Figure it out without leaving the current context.

Outline
Get a nice outline of your module on the side and jump between functions.

Workspace Symbols
Jump to the module you're looking for, in no time.

Folding
Focus on what's important, fold the rest.

Snippets
Quickly insert parametrized, reusable pieces of code.

Suggest Type Specs
Annotate your Erlang programs with type information.

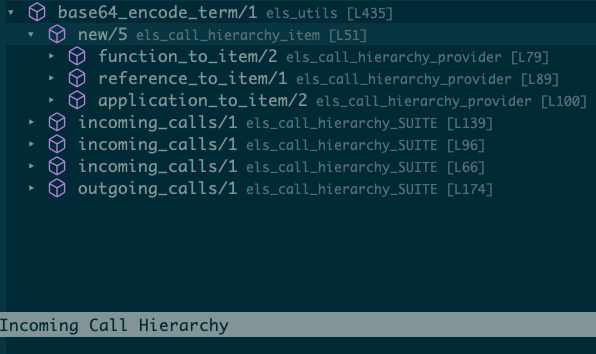
Call Hierarchy
The Call Hierarchy feature lets you explore callers of a given function (known as incoming calls), as well as show which functions are called by a given function (known as outgoing calls).
For an overview of what Call Hierarchy may look like, have a look to this video.
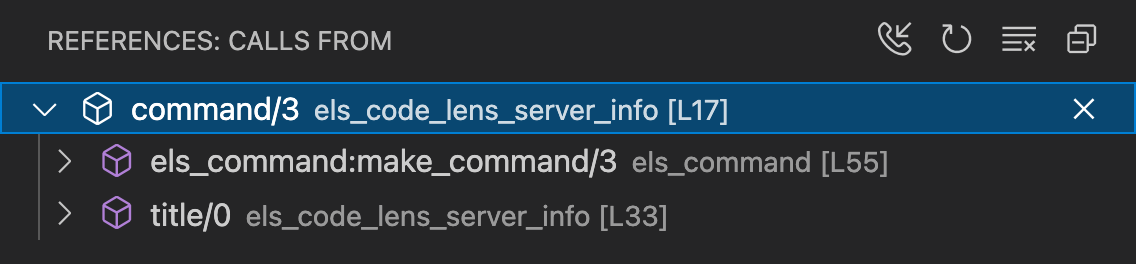
To display the Call Hierarchy panel, right-click on the name of a function and select Show Call Hierarchy. You can use the newly opened panel to navigate through the hierarchy of calls.
To switch between incoming calls and outgoing calls simply use the phone icon on the top-right corner of the panel.
The feature is provided by the lsp-treemacs package.
To show the incoming calls hierarchy:
M-x lsp-treemacs-call-hierarchy
To show the outgoing calls hierarchy:
C-u M-x lsp-treemacs-call-hierarchy
For more information please refer to the official lsp-treemacs documentation.
Code Actions
Code Actions are a mechanism providing the user with possible corrective actions right next to an error or warning. If actions are available, a light bulb or similar icon appears next to the error or warning. When the user clicks the light bulb (or hits a shortcut), a list of available code actions is presented.
Currently Erlang LS support code actions for:
- Exporting unused functions
- Prepending an underscore (
_) to an unused variable - Correct a mistyped name for an unbound variable
- Fix a module name to match the corresponding filename
Refactoring via Wrangler
Erlang LS can offer refactoring capabilities such as fold expression, extract function, rename variable and many more via the Wrangler extension. For details on how to enable Wrangler for Erlang LS, please refer to the official documentation.